Update: August 8, 2016
Probability of Clinton Win: 99% | Probability of Trump Win: 1%
Clinton – Trump Spread: 10.9%
Clinton now has reached the 99% probability of winning milestone, if the election were to be held today. The post convention polls continue to solidify Clinton’s lead. This is the highest lead that Clinton has had since August of last year.
Update: August 4, 2016
Probability of Clinton Win: 97% | Probability of Trump Win: 3%
Clinton – Trump Spread: 8.0%
Clinton has now consolidated her lead over Trump. Trump was able to tie the race post his convention, but since then it has been all Clinton. With this, Clinton is approaching her best lead since August of last year.
Update: August 2, 2016
Clinton continues to improve her position:
Probability of Clinton Win: 93% | Probability of Trump Win: 7%
Original Article: August 1, 2016
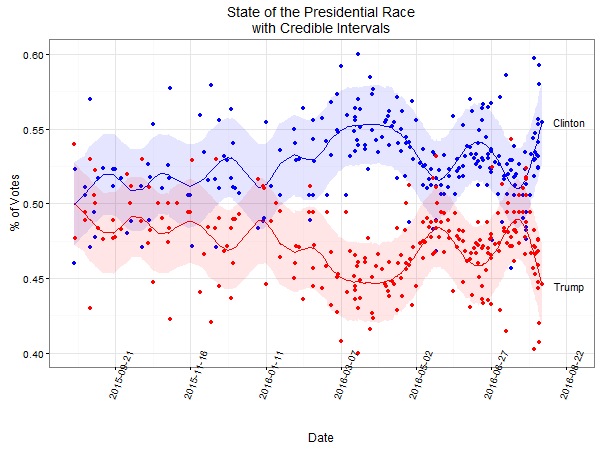
We continue to track the state of the presidential race. Key Results as of August 1, 2016:
Probability of Clinton Win: 82% | Probability of Trump Win: 18%
The Democratic convention managed to stop and reverse the Clinton fall following the FBI disclosures and the Republican convention. We are now back at a position that is closer to the longer run average.
Technical Analysis
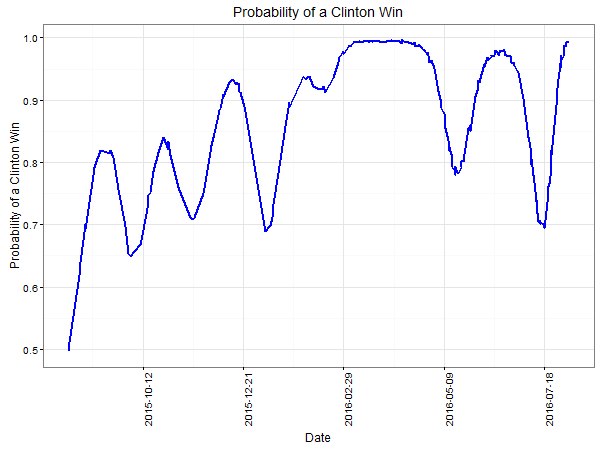
We using a Gaussian Process model to analyze the state of the race. This model produces a smooth set of estimated spreads and probabilities of winning over the analysis time period. In time series analysis, there is the concept of “smoothing” and the concept of “filtering”. With smoothing, the estimated spread at any particular point in time represents the best estimate given all past and future data. If you had a noisy set of points on a page, and you are trying to draw a single line that represents the average position of the dots, then you would naturally choose to draw a smooth line that is consistent with the statistical definition of smoothing. Thus a colloquial understanding of smoothing and the statistical process of smoothing are consistent. Filtering is subtly different. With filtering the best estimate at a particular point in time of the state of the race is represent by the best estimate given all historic data, but ignoring data after that point in time, if any. Thus the filtered line and the smoothed line would match up only at the very right hand side of the graph (when there is no future data), but earlier points could differ.
Why is this important? You will note that our prior analysis showed a practically tied probability of win / loss for Clinton and Trump, but the above graph “Probability of Clinton Win” does not drop to the 50% level for the last week. In essence what this is saying is that the bounce experienced post the Republican convention has been smoothed out from the analysis.
A key question is how much smoothing should be applied. In turns out that the degree of smoothing is a key output that is automatically determined by the Gaussian Process model. The model uses a Bayesian process to solve for the degree of smoothing parameter.